![]()
![]()
|
|
|
|
Excel Chapter 4C of 24: Excel Pivot Tables NOTE: If Excel recognizes your set of data as a database you can sort the data The pivot table is a powerful analysis tool that allows the analyst to organise any database into tables with all kinds of sub-totals (SUM, COUNT, AVERAGE...) comparing sales of products by stores, sales of products by cities, sales of products by stores, by month AND by cities, etc. First let's demystify the pivot table. The pivot table is a powerful data analyzing tool but less than 1% of the thousands of people that I have worked with use it. Before you get into pivot tables be sure that you know how to use the filters in Excel and that you have discovered the magic function (SUMPRODUCT). Pivot tables are designed for dynamic analyses of large quantities of data but as a reporting tool it is somewhat limited (if the report is for you or your immediate colleagues everything is fine but if the report is for your boss or a VP or the public then...). To develop a report with the exact layout that you need 75% of the automation is made possible through SUMPRODUCT. Here is an example of a pivot table: You have data supplied to you as TXT or CSV files or your import data from a database with Microsoft Query in the following format:
Imagine such a table in your spreadsheet with 50,000 lines of data and you want to create a table answering to the following questions: How many of each products were sold by city?
How much of each products were sold by city?
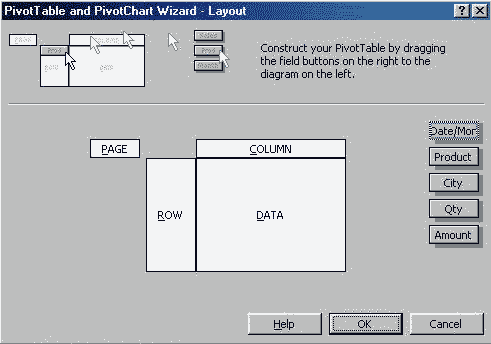
To complete such a task instantaneously, you will use the pivot table. To create the first pivot table (Products by City), copy the raw data in Excel. Select the table go to "Menu/Data/PivotTable and PivotChart Report" . In the first dialog box, choose " Microsoft Excel list or database" , click "Next" . In the second dialog box, accept the " Range" by clicking " Next" . In the third dialog box Click on " Layout..." and you will see the following dialog box:
Drag the small gray buttons on your right onto the white shape in the middle, "Qty" over " ATA" , Product over " RW" and "City" over " OLUMN" . Click " OK" nd then "Finish" . You have just created your first pivot table. To create the second Pivot Table with the same data, right click anywhere on the first Pivot Table, select "Wizard/Layout" . Drag the "QTY" button off "DATA" and replace it by "Amount" . To create any other Pivot Table from the same data, right click anywhere on the first Pivot Table, select "Wizard/Layout" and move the gray buttons around. For example, "Product" over "ROW" and "Date/Month" over "COLUMN" will give you a pivot table about "Sales of products by month" . Try this one: "Product" over "ROW" and, "City" and "Date/Month" over "COLUMN" . You have now "Sales of products by city and by month" . Discover AutoFilter in Excel and the magic function SUMPRODUCT before your go too far with pivot tables. |
|
Next Chapter: Sorting Data in Excel |
|
|
|
Excel Pivot Tables